Why I built gridtwin, the electrical half of a single-line diagram
A case study of gridtwin: three design decisions behind an educational power flow twin, with the numbers, the trade-offs and the limits I state up front.
A single-line diagram shows connections between objects. However, it does not show what flows between them. This was troubling to me for some time and so I decided to address this issue.
I currently work on software which draws single-line diagrams of high-voltage substations: Angular and diagram rendering in the browser, Java 21 and Quarkus behind it. I decided to create the other side of this to model the electrical implications of these diagrams. I called this project gridtwin. It combines domain knowledge, numerical methods, a 3D front end and a Java back end in one place.
Opening a breaker in either the 3D substation or the single-line diagram will cause an AC power flow to redistribute the load, overload a line and potentially cascade into an outage. These simulations are run on the public IEEE 14-bus and IEEE 30-bus test cases. I will show three decisions I would defend in this case study, and also discuss what I left out.
What a frontend engineer needs from a power flow
A network consists of buses and branches. Each bus has a voltage magnitude and angle. There are loads and generators which consume and produce power. AC power flow uses the power balance at each bus to compute the voltages.
These equations are nonlinear and thus Newton-Raphson is used. Each iteration involves solving a linear system derived from a Jacobian matrix. The Jacobian is sparse as each bus only interacts with its neighbours. There is also a slack bus which absorbs any mismatch that remains and fixes the angle reference.
That is all the theory required for the rest of this post. Overload flags, the cascade and line loading are all computed using the solved voltages.
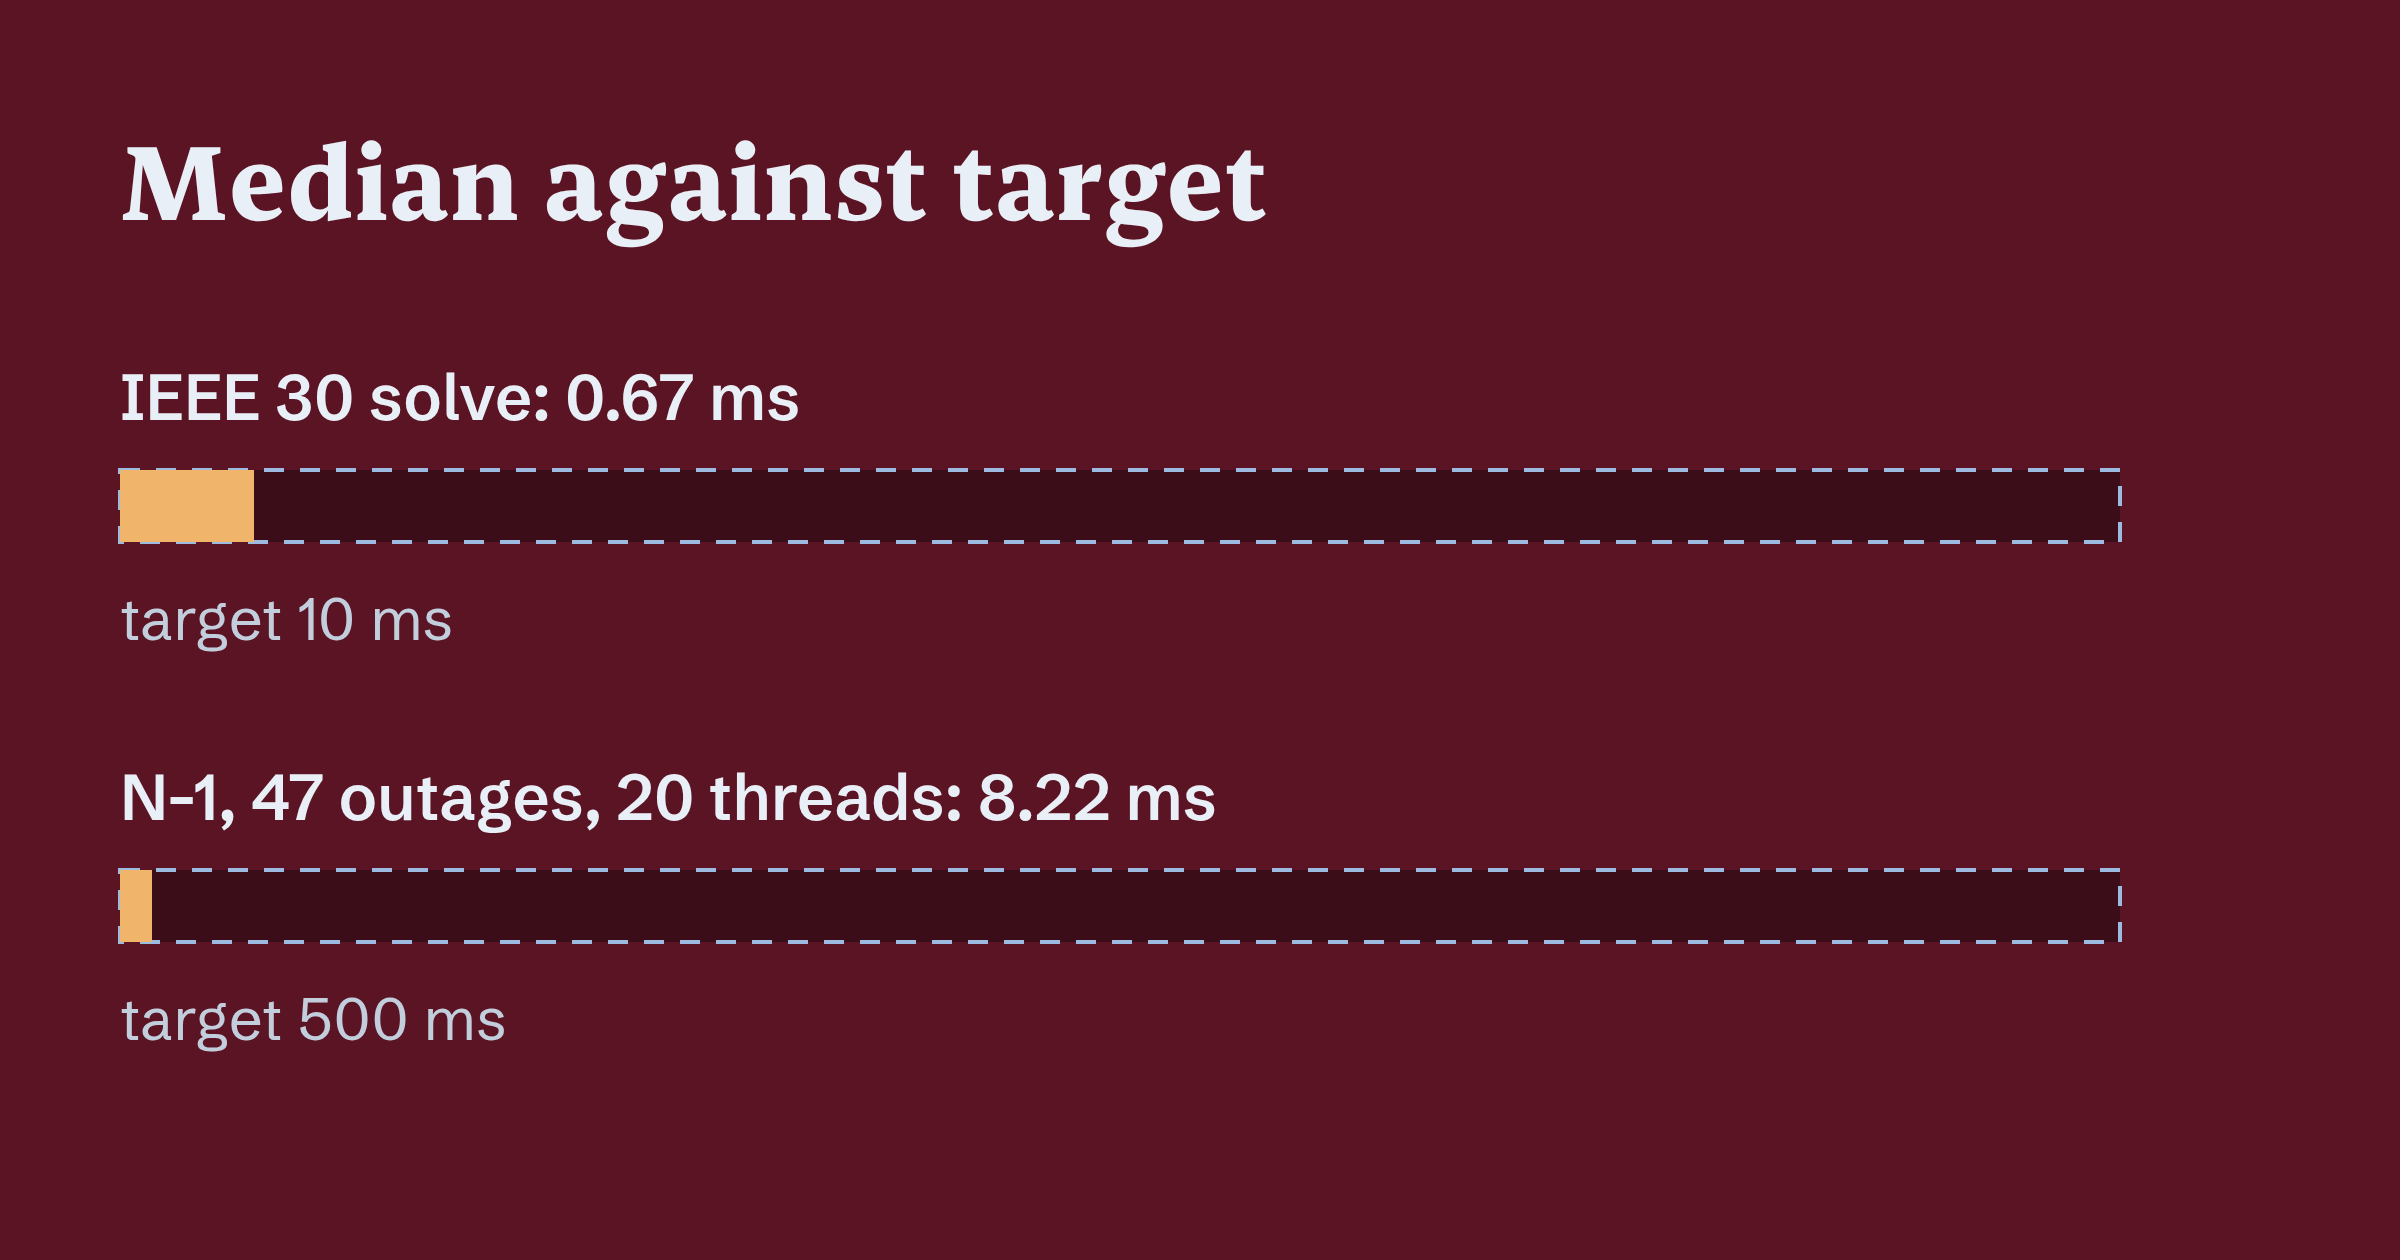
The solver is thus a function transforming network state into numbers. The UI is a function of those numbers. Each breaker click triggers a new solve. This is only possible because the solve is cheap. For example an IEEE 30 solve from a flat start takes 0.67 ms median compared to a 10 ms target.
Matching MATPOWER down to the convention
I chose MATPOWER 8.1 as the referee. I created 16 base case reference solutions and 4 N-1 reference files by executing MATPOWER inside Docker using GNU Octave. My solver is tested against these solutions. Voltage magnitude tolerance is 1e-6 pu and angle tolerance is 1e-4 degrees. The maximum error across all tested cases is 8.23e-9 pu and 4.06e-7 degrees.
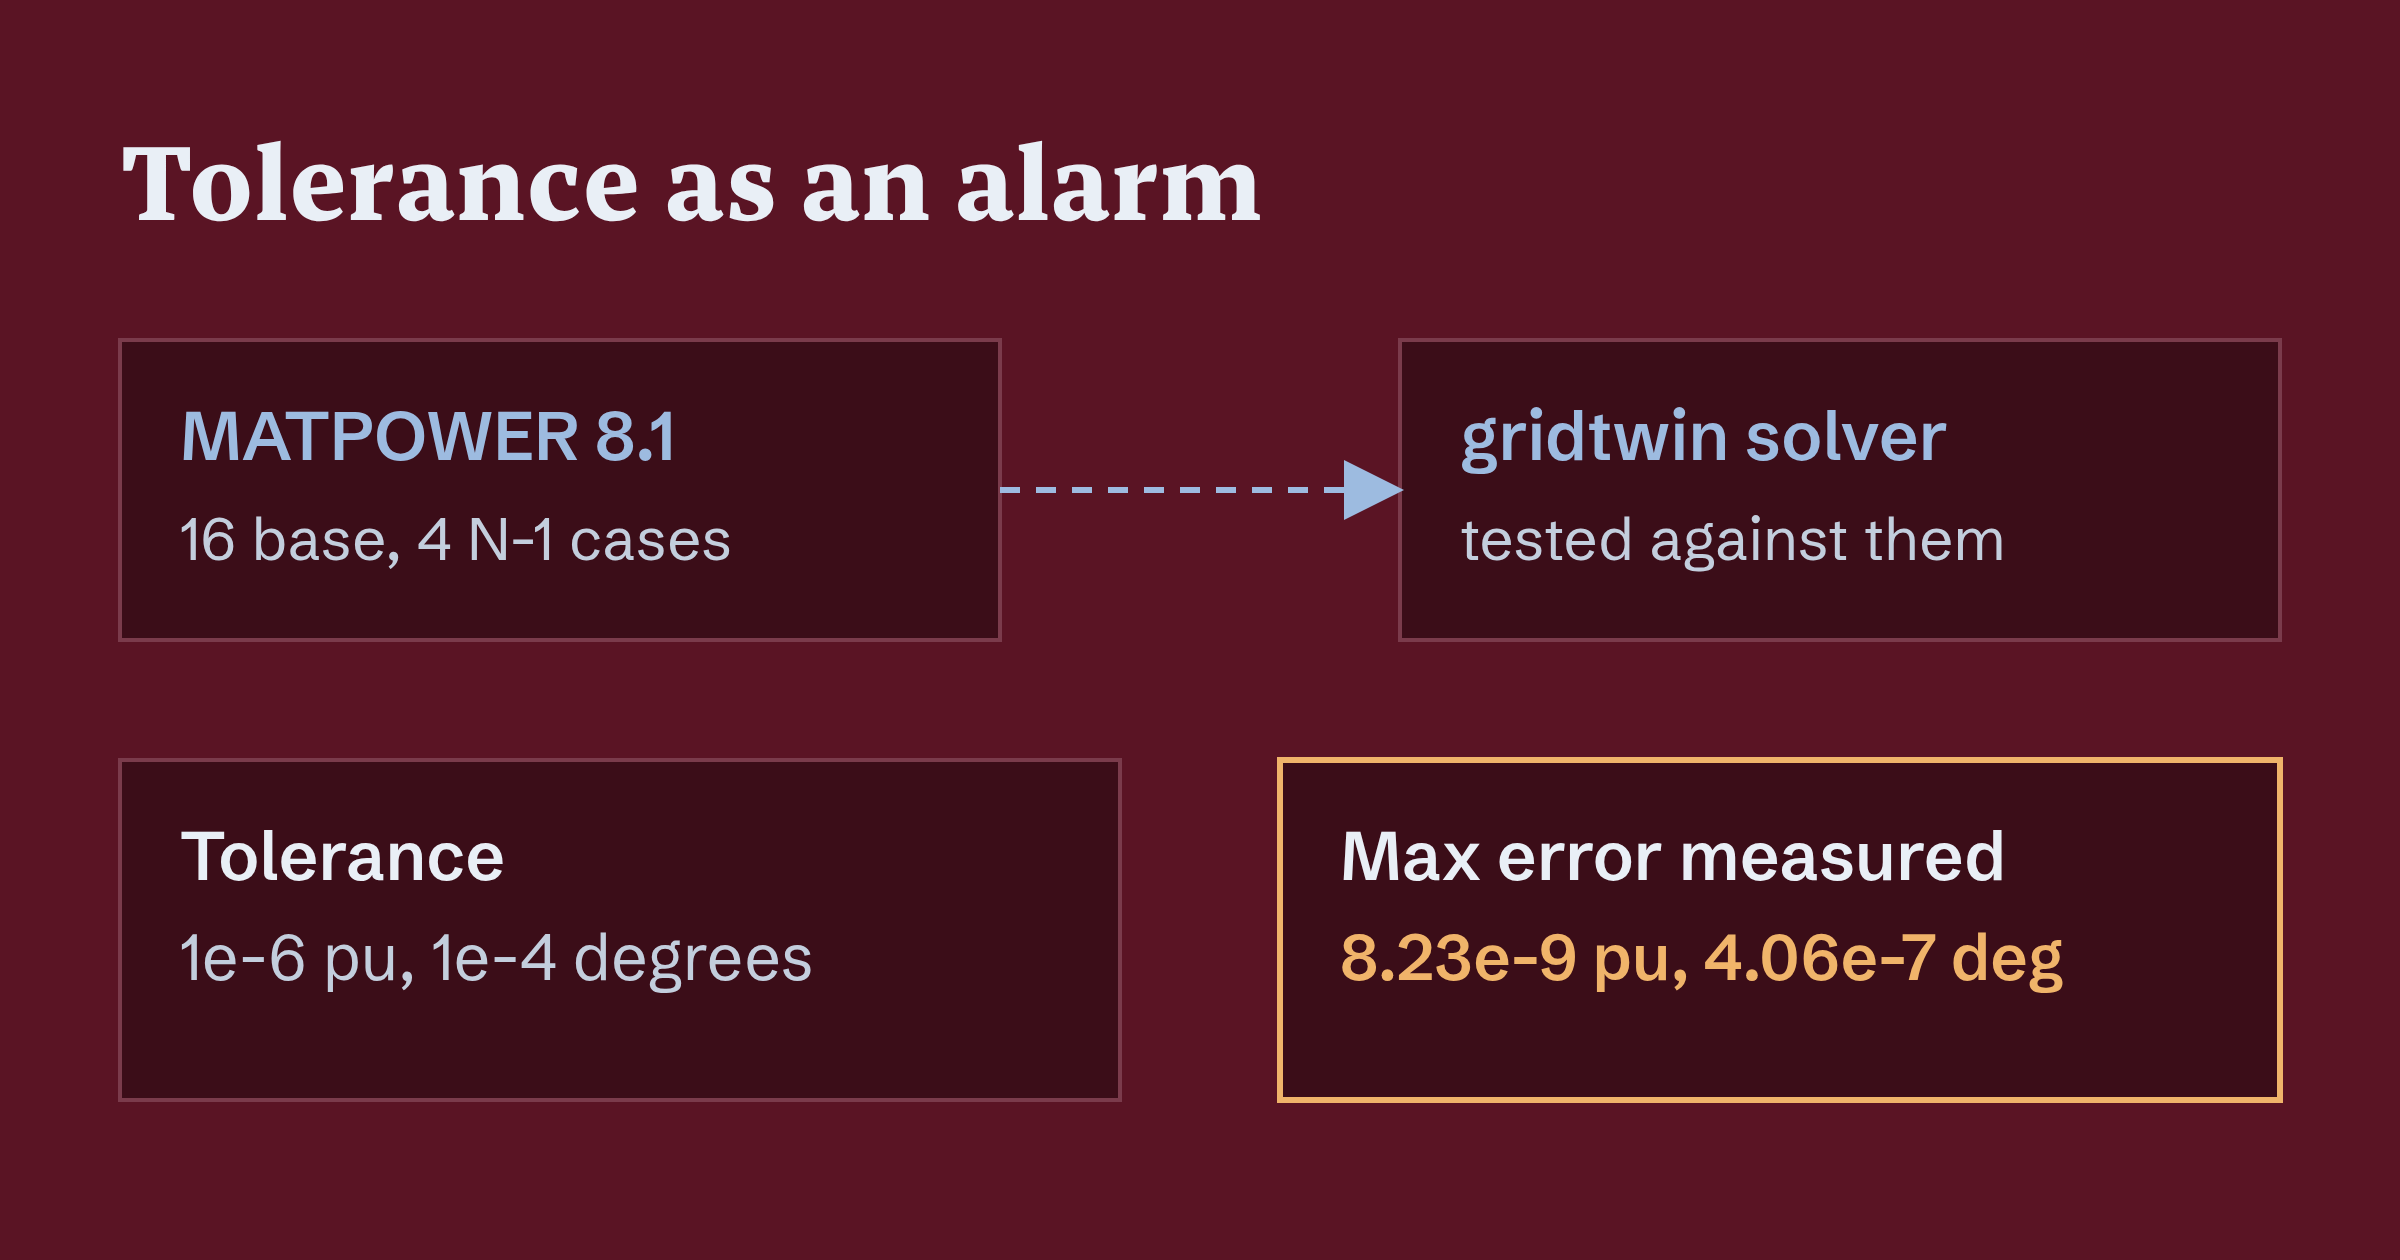
This was not achieved through improved solving algorithms or numerics. Rather, it was achieved through attention to modeling conventions. For example, transformer tap locations, handling of reactive limits (all violating generators converted at once or one at a time), and whether the slack generator is limited all affect results to the third decimal place. A solver may be correct but still differ from the reference due to modeling differences. These differences can only be made explicit through documentation. I documented these in an ADR.
Another discovery came from a property test on random stressed networks. There exists a second, low-voltage root of the power flow equations near 0.4 pu. A warm start may settle on this solution. A solution below 0.5 pu now triggers a second run from a flat start.
function solveSafely(net: Network, warm: Solution): Solution {
  const first = solver.solve(net, warm);
  if (first.minVoltage() < 0.5) {
    return solver.solve(net, Solution.flat(net));
  }
  return first;
}
A demo for the narrow case where a loose tolerance would have also been acceptable only requires apparent correctness. The most significant issue with my implementation is that 1e-6 pu is unreasonable for an educational toy. I argue that the tolerance is an alarm. Without it, I would not be able to distinguish between a bug and a convention, and the wrong root would still be on screen. It would look like a very bad day for the grid.
A match to MATPOWER confirms that I made the same choices as MATPOWER. This does not imply anything about any real grid.
Islands and a slack per island
A breaker can divide the network into two parts. Prior to the solver seeing the network, the topology processor must deal with the fact that the solver assumes one connected network with one slack.
Islands are created using union-find on branches and closed switching devices connecting nodes. Each energized island is assigned a slack. Islands with no source are de-energized and their load is shed.
function findIslands(count: number, closed: [number, number][]): number[][] {
  const parent = Array.from({ length: count }, (_, i) => i);
  const find = (x: number): number => {
    while (parent[x] !== x) {
      parent[x] = parent[parent[x]];
      x = parent[x];
    }
    return x;
  };
  for (const [a, b] of closed) {
    parent[find(a)] = find(b);
  }
  const groups = new Map<number, number[]>();
  for (let i = 0; i < count; i++) {
    const root = find(i);
    groups.set(root, [...(groups.get(root) ?? []), i]);
  }
  return [...groups.values()];
}
This is a sketch in TypeScript but the actual implementation is in Java. The trade-off is that load shedding is a modelling decision with a visible cost. The load disappears from the balance, and which generator becomes the slack of an island changes who absorbs the mismatch. I documented both choices in an ADR rather than leaving them as defaults in a loop.
The same idea shows up in interlocks. A line with an open breaker can still be fed from its far end, so the code needs a notion of a live section. Earthing that line is refused.
A fork-join pool for N-1 contingencies
An N-1 analysis removes one element at a time and asks whether the network still holds. For IEEE 30 this gives 47 outages, each solved using an independent power flow.
I solve these using a fork-join pool. Virtual threads are the modern default in Java 21. I was going to use these, but they make waiting cheap, not computing. Our outage solvers do not wait on anything. They use CPU entirely during their execution. Having more threads than cores does not give benefit. A bounded pool sized to the hardware is the honest choice.
Using 20 threads I achieve a median of 8.22 ms for an IEEE 30 N-1 run of 47 outages, compared to a 500 ms target. I intentionally set the target relatively high to leave room for the interactive scenario where each click can trigger a fresh analysis.
The scenario in which virtual threads offer benefit is a contingency that has to fetch something per outage, from a database or another service. The threads will then be blocked during each outage and cheap blocking is desired in this scenario.
I anticipate the objection that a fixed pool is old-fashioned. Perhaps. But it is a bounded resource, and it is visible in the design rather than hidden within the scheduler. It is also easy to reason about under load. The number comes from one machine, so I treat it as a measured result, not a promise.
What I did not build, and where the model stops
I wrote the cuts down in ADR 0027. There is no state estimation or fast decoupled power flow. IEEE 30 is solved and validated but there is no substation visible in the UI.
I believe that at this system size the sparse Newton-Raphson solve is well within the computation budget. A faster approximation would require a second solver that would have to stay in agreement with the first solver. State estimation needs measurements. A twin of a public test case does not have any real measurements to estimate from.
This is an educational model on public IEEE test cases. The substation replacing bus 4 is made up. The cascade is a static simplification. A branch trips the instant it passes 120% of its rating. There is no protection timing. Sessions are stored in memory and the demo resets every hour.
I do not intend for gridtwin to represent any actual power system and nothing within gridtwin represents an actual power system.
Build the half your drawing leaves out
A diagram is a collection of claims about a system. If you only ever draw it, nobody checks the claims.
Creating the other half of the system gave me more insight into the diagrams I create at work than creating the diagrams themselves. I also lost the comfort of a picture that can’t be wrong, and I miss that a little.
Open the last screen you shipped that draws something from a domain and ask what it would take to check it against an independent reference. If you can name that reference, write the first test this week.
The code is at github.com/adiyy2001/gridtwin, MIT. The live demo is at gridtwin.adrianturbinski.pl.